River nutrient study update, July 2022
On 04 April 2022 I wrote River nutrient study. Recently I followed up about results.
David Brown, with a Horizons Regional Council email address, replied:
Sorry for the delay getting back to you, I had been trying to find out some more information. What I can report is that a large amount of data was collected for this project including:
· Full bathymetric mapping (survey) of the tidal zone of the Waikawa stream
· We collected just under six months of continuous water level data to help calculate the tidal movement in the Waikawa
· We measured a full tidal cycle with 39 flow Gaugings starting from 6am through to 6:30pm
· We also collected continuous salinity data during this study and mapped the extent of the salt water in the lower reaches
All of this data has been sent to a consultant to build a nutrient model. Unfortunately we have not yet seen the results of this / we are awaiting the final report.
I can say the maximum flow we recorded on the day was: 6,655 litres per second (flowing down stream)
And the minimum flow was: -10,626 litres per second (incoming tide, flowing upstream)
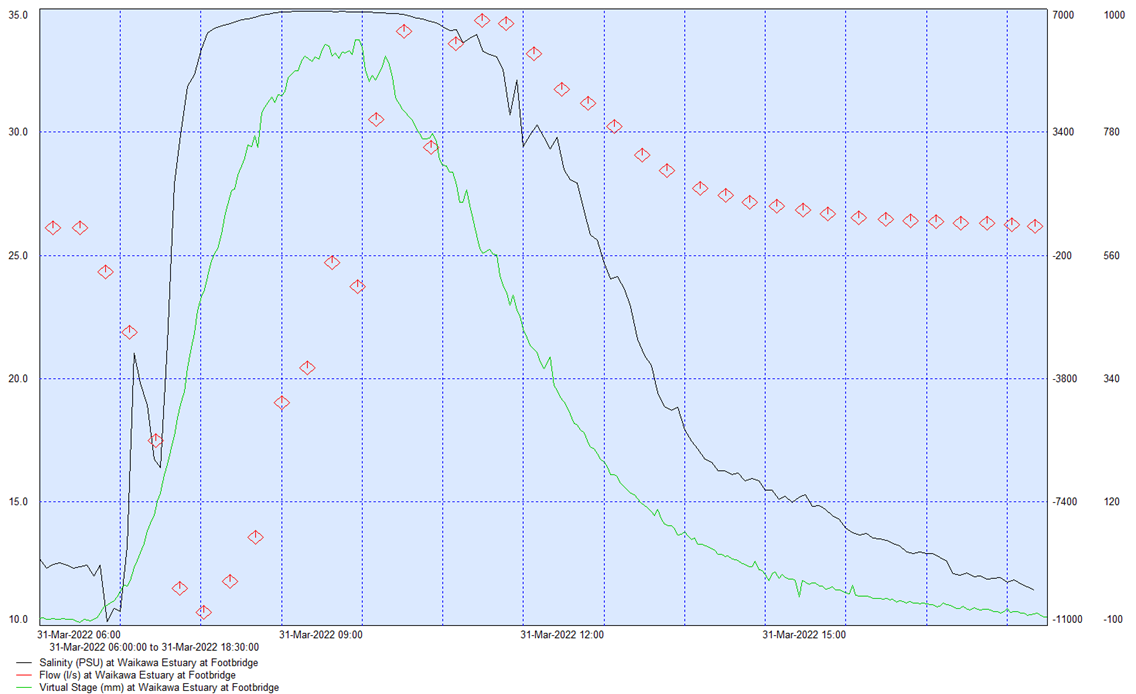
Salinity is on the left axis is essentially in parts per thousand.
Flow is on the first of the right hand scales
Stage or water level scale is on the right hand axis, furthest on the right.